Adding custom metrics in Ambari Metrics
In this article I will show you how to add custom metrics in the Hortonworks Ambari Metrics for following Zookeeper health with Grafana.
Previously I wrote an article on how to use the 4lw commands for monitor the Zookeeper health.
But following the Zookeeper health is interresting if we could use Grafana to make dashboard and understand better the Zookeeper performance and bottleneck.
Ambari Metrics API
For create custom metrics in Ambari Metrics, we will use the Collector from Ambari Metrics API
POST http://<ambari-metrics-collector>:6188/ws/v1/timeline/metrics
Instead of using a curl, I have updated my BigDataApi to add an AmbariMetricsApi class for get or put metrics in AMS Collector.
Using BigDataApi to send metrics
I choose to make a python script which could be use to get output of the 4lw command in its stdin and use it to send to AMS collector.
[BigDataApi]> echo mntr | nc localhost 2181 | ./test_ams.py --type mntr --hostname sandbox-hdp.hortonworks.com
[BigDataApi]> echo wchc | nc localhost 2181 | cut -d'/' -f2| egrep -v "^0x|^$" | sort | uniq -c | sort -n |./test_ams.py --type wchc --hostname sandbox-hdp.hortonworks.com
Control in AMS-HBase
You can use phoenix to control that your metrics are in the AMS metadata
[ams@sandbox-hdp ~]$ export HBASE_CONF_DIR=/etc/ambari-metrics-collector/conf
[ams@sandbox-hdp ~]$ /usr/hdp/current/phoenix-client/bin/sqlline.py sandbox-hdp.hortonworks.com:61181:/ams-hbase-unsecure
If you are on a kerberized cluster use /ams-hbase-secure
[ams@sandbox-hdp ~]$ export HBASE_CONF_DIR=/etc/ambari-metrics-collector/conf
[ams@sandbox-hdp ~]$ /usr/hdp/current/phoenix-client/bin/sqlline.py sandbox-hdp.hortonworks.com:61181:/ams-hbase-secure
If your Ambari Metrics is not embedded but distributed, use the zookeeper port 2181
[ams@sandbox-hdp ~]$ export HBASE_CONF_DIR=/etc/ambari-metrics-collector/conf
[ams@sandbox-hdp ~]$ /usr/hdp/current/phoenix-client/bin/sqlline.py sandbox-hdp.hortonworks.com:2181:/ams-hbase-secure
Check Metadata
0: jdbc:phoenix:sandbox-hdp.hortonworks.com:6> !tables
+------------+--------------+--------------------------+---------------+
| TABLE_CAT  | TABLE_SCHEM  |        TABLE_NAME        |  TABLE_TYPE   |
+------------+--------------+--------------------------+---------------+
|            | SYSTEM       | CATALOG                  | SYSTEM TABLE  |
|            | SYSTEM       | FUNCTION                 | SYSTEM TABLE  |
|            | SYSTEM       | SEQUENCE                 | SYSTEM TABLE  |
|            | SYSTEM       | STATS                    | SYSTEM TABLE  |
|            |              | CONTAINER_METRICS        | TABLE         |
|            |              | HOSTED_APPS_METADATA     | TABLE         |
|            |              | INSTANCE_HOST_METADATA   | TABLE         |
|            |              | METRICS_METADATA         | TABLE         |
|            |              | METRIC_AGGREGATE         | TABLE         |
|            |              | METRIC_AGGREGATE_DAILY   | TABLE         |
|            |              | METRIC_AGGREGATE_HOURLY  | TABLE         |
|            |              | METRIC_AGGREGATE_MINUTE  | TABLE         |
|            |              | METRIC_RECORD            | TABLE         |
|            |              | METRIC_RECORD_DAILY      | TABLE         |
|            |              | METRIC_RECORD_HOURLY     | TABLE         |
|            |              | METRIC_RECORD_MINUTE     | TABLE         |
+------------+--------------+--------------------------+---------------+
0: jdbc:phoenix:sandbox-hdp.hortonworks.com:6> select METRIC_NAME,APP_ID,START_TIME,SUPPORTS_AGGREGATION from METRICS_METADATA where APP_ID='zookeeper';
+-------------------------------------------+------------+----------------+-----------------------+
|                METRIC_NAME                |   APP_ID   |   START_TIME   | SUPPORTS_AGGREGATION  |
+-------------------------------------------+------------+----------------+-----------------------+
| zookeeper.zk_approximate_data_size        | zookeeper  | 1552221892508  | true                  |
| zookeeper.zk_avg_latency                  | zookeeper  | 1552221892508  | true                  |
| zookeeper.zk_ephemerals_count             | zookeeper  | 1552221892508  | true                  |
| zookeeper.zk_max_file_descriptor_count    | zookeeper  | 1552221892508  | true                  |
| zookeeper.zk_max_latency                  | zookeeper  | 1552221892508  | true                  |
| zookeeper.zk_min_latency                  | zookeeper  | 1552221892508  | true                  |
| zookeeper.zk_num_alive_connections        | zookeeper  | 1552221892508  | true                  |
| zookeeper.zk_open_file_descriptor_count   | zookeeper  | 1552221892508  | true                  |
| zookeeper.zk_outstanding_requests         | zookeeper  | 1552221892508  | true                  |
| zookeeper.zk_packets_received             | zookeeper  | 1552221892508  | true                  |
| zookeeper.zk_packets_sent                 | zookeeper  | 1552221892508  | true                  |
| zookeeper.zk_path.ambari-metrics-cluster  | zookeeper  | 1552227826949  | true                  |
| zookeeper.zk_path.hiveserver2             | zookeeper  | 1552227826949  | true                  |
| zookeeper.zk_pathambari-metrics-cluster   | zookeeper  | 1552227577993  | true                  |
| zookeeper.zk_pathhiveserver2              | zookeeper  | 1552227577993  | true                  |
| zookeeper.zk_watch_count                  | zookeeper  | 1552221892508  | true                  |
| zookeeper.zk_znode_count                  | zookeeper  | 1552221892508  | true                  |
+-------------------------------------------+------------+----------------+-----------------------+
15 rows selected (0.185 seconds)
0: jdbc:phoenix:sandbox-hdp.hortonworks.com:6>  select METRIC_NAME,APP_ID,SERVER_TIME,METRIC_MAX from METRIC_AGGREGATE where METRIC_NAME='zookeeper.zk_packets_sent' order by SERVER_TIME;
+----------------------------+------------+----------------+-------------+
|        METRIC_NAME         |   APP_ID   |  SERVER_TIME   | METRIC_MAX  |
+----------------------------+------------+----------------+-------------+
| zookeeper.zk_packets_sent  | zookeeper  | 1552221780000  | 47645.0     |
| zookeeper.zk_packets_sent  | zookeeper  | 1552221810000  | 47645.0     |
| zookeeper.zk_packets_sent  | zookeeper  | 1552221840000  | 47645.0     |
| zookeeper.zk_packets_sent  | zookeeper  | 1552221870000  | 47645.0     |
| zookeeper.zk_packets_sent  | zookeeper  | 1552221900000  | 47645.0     |
| zookeeper.zk_packets_sent  | zookeeper  | 1552221930000  | 47645.0     |
| zookeeper.zk_packets_sent  | zookeeper  | 1552221960000  | 47645.0     |
| zookeeper.zk_packets_sent  | zookeeper  | 1552221990000  | 47645.0     |
| zookeeper.zk_packets_sent  | zookeeper  | 1552222260000  | 50858.0     |
| zookeeper.zk_packets_sent  | zookeeper  | 1552222290000  | 50858.0     |
| zookeeper.zk_packets_sent  | zookeeper  | 1552222320000  | 50858.0     |
| zookeeper.zk_packets_sent  | zookeeper  | 1552222350000  | 50858.0     |
| zookeeper.zk_packets_sent  | zookeeper  | 1552222380000  | 50858.0     |
| zookeeper.zk_packets_sent  | zookeeper  | 1552222410000  | 50858.0     |
| zookeeper.zk_packets_sent  | zookeeper  | 1552222440000  | 50858.0     |
| zookeeper.zk_packets_sent  | zookeeper  | 1552222470000  | 50858.0     |
| zookeeper.zk_packets_sent  | zookeeper  | 1552222620000  | 51991.0     |
| zookeeper.zk_packets_sent  | zookeeper  | 1552222650000  | 51991.0     |
| zookeeper.zk_packets_sent  | zookeeper  | 1552222680000  | 51991.0     |
| zookeeper.zk_packets_sent  | zookeeper  | 1552222710000  | 51991.0     |
| zookeeper.zk_packets_sent  | zookeeper  | 1552223820000  | 56439.0     |
| zookeeper.zk_packets_sent  | zookeeper  | 1552223850000  | 56439.0     |
| zookeeper.zk_packets_sent  | zookeeper  | 1552223880000  | 56439.0     |
| zookeeper.zk_packets_sent  | zookeeper  | 1552223910000  | 56439.0     |
| zookeeper.zk_packets_sent  | zookeeper  | 1552223940000  | 56439.0     |
| zookeeper.zk_packets_sent  | zookeeper  | 1552223970000  | 56439.0     |
| zookeeper.zk_packets_sent  | zookeeper  | 1552224000000  | 56439.0     |
| zookeeper.zk_packets_sent  | zookeeper  | 1552224030000  | 56439.0     |
| zookeeper.zk_packets_sent  | zookeeper  | 1552227780000  | 11388.0     |
| zookeeper.zk_packets_sent  | zookeeper  | 1552227810000  | 11388.0     |
| zookeeper.zk_packets_sent  | zookeeper  | 1552227840000  | 11388.0     |
| zookeeper.zk_packets_sent  | zookeeper  | 1552227870000  | 11388.0     |
| zookeeper.zk_packets_sent  | zookeeper  | 1552227900000  | 11388.0     |
| zookeeper.zk_packets_sent  | zookeeper  | 1552227930000  | 11388.0     |
| zookeeper.zk_packets_sent  | zookeeper  | 1552227960000  | 11388.0     |
| zookeeper.zk_packets_sent  | zookeeper  | 1552227990000  | 11388.0     |
+----------------------------+------------+----------------+-------------+
36 rows selected (0.075 seconds)
As you can see we have metrics in the AMS Hbase.
There is a trap with AMS Collector, if the metrics are older than 2 minutes (default value) they will not be insert in the METRIC_RECORD table but they will be in the METRICS_METADATA table.
The impact in Grafana is the possibility to see the component and the metric name but never see any point / graph.
So if you want to load some metrics older than the default window, add in custom ams-site this parameter to allow metrics old up to a day.
timeline.metrics.service.outofband.time.allowance.millis=86400000
Zookeeper Dashboard in Grafana
Connect to Grafana via Ambari (Ambari Metrics->Quick Links) and connect with an account that have permission to create a Dashboard.
In the combo Dashboard select +New and in the green row, add panel, select graph
You will be able to select in the component name zookeeper and then in the metric name one of the zookeeper metric
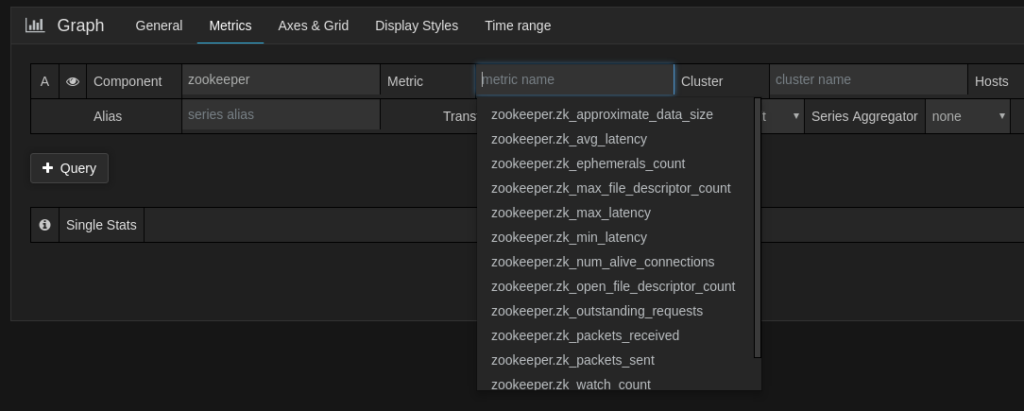
You have now the possibility to create very interesting dashboard for filling the lack of Zookeeper metrics on the Hortonworks distribution.
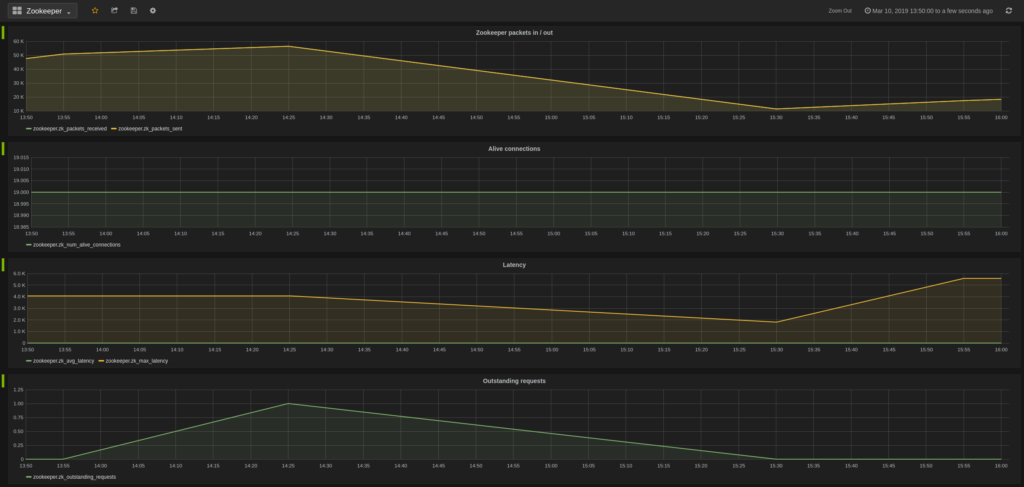
The more important metrics are the
- Outstanding requests
- Latency
- Alive connections
- Followers
- Watch count
- ZK Paths
Feel free to feedback to me all your comments on this article that I hope will help you in your Zookeeper supervision duty
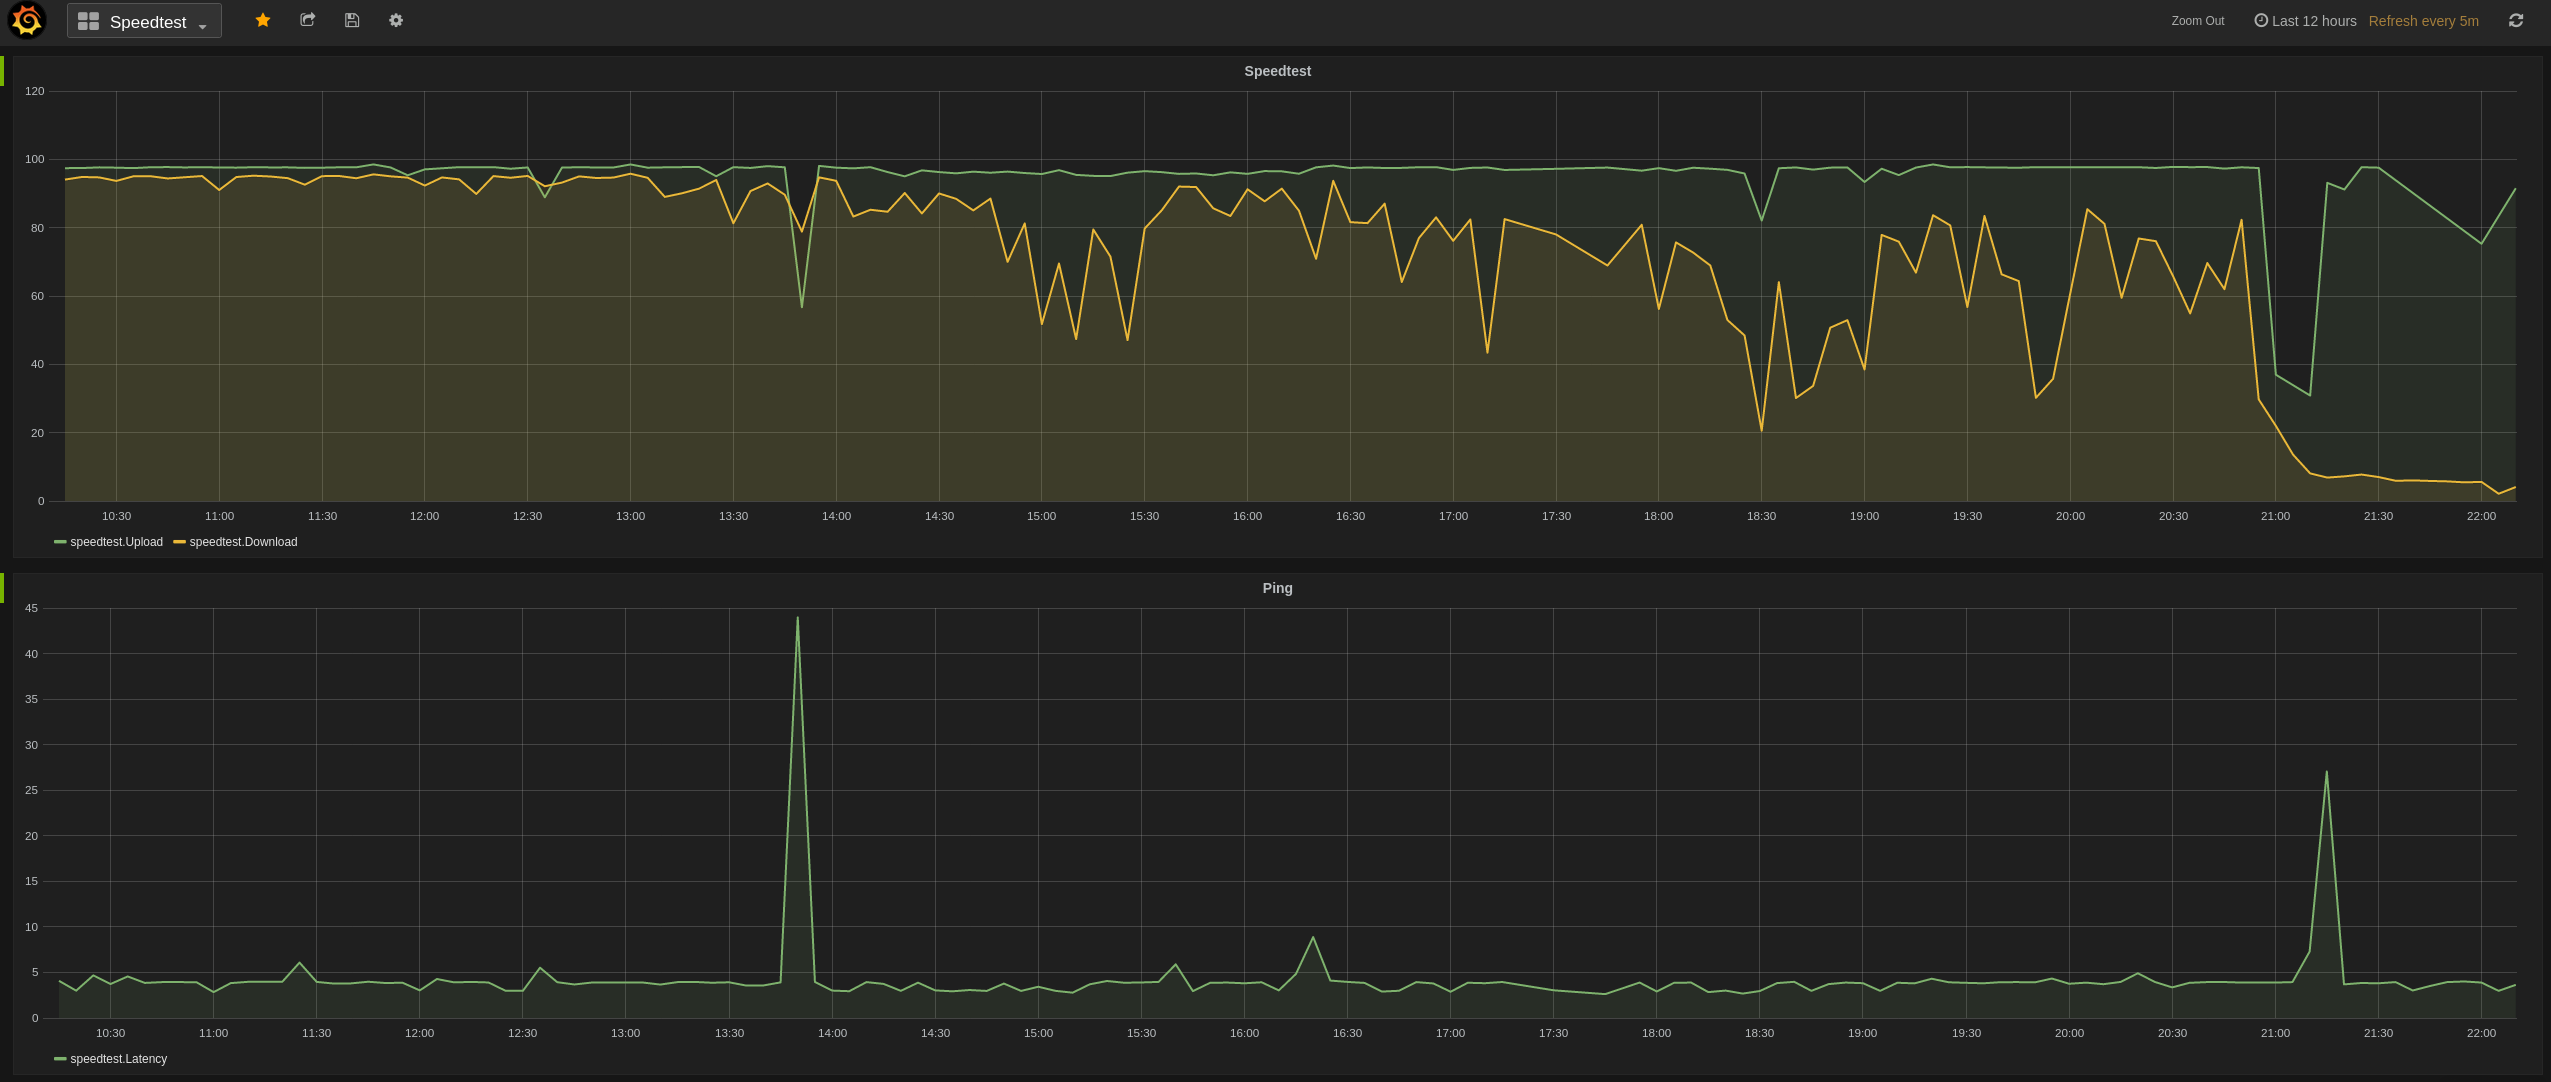
Update 2020/06/19
I have added a new metrics during the Covid-19 confinement as the network have some trouble with the bandwidth.
So using the same api with the speedtest client to have some graph of the availability of my network connection.
Adding this simple piece of code in my crontab for generating some stats every 5 minutes and send the result to the ambari-metrics api
*/5 * * * * echo "YES\n" |speedtest --progress=no| (cd /Developpement/Python/BigDataApi && ./test_ams.py --type speedtest --hostname sandbox-hdp.hortonworks.com)
With Grafana I have made a dashboard to show the network bandwidth availability and sent it to the support (seems they don’t have tools like that 🙂 ).